02/12/2019
Flash boursier
Key data
| USD/CHF | EUR/CHF | SMI | EURO STOXX 50 | DAX 30 | CAC 40 | FTSE 100 | S&P 500 | NASDAQ | NIKKEI | MSCI Emerging MArkets | |
|---|---|---|---|---|---|---|---|---|---|---|---|
| Latest | 1,00 | 1,10 | 10 493,24 | 3 703,58 | 13 236,38 | 5 905,17 | 7 346,53 | 3 140,98 | 8 665,47 | 23 293,91 | 1 040,05 |
| Trend | |||||||||||
| %YTD | 1,89% | -2,27% | 24,49% | 23,39% | 25,36% | 24,83% | 9,19% | 25,30% | 30,60% | 16,38% | 7,69% |
Highlights:
1. Trump support for Hong Kong stokes tensions
2. Pick-up in China’s growth expected for 2020
Unexpected bounce in Chinese manufacturing output
Leading equity markets around the globe gained in November, lifted by signs of progress towards a ‘phase-one’ trade deal between the US and China and by stable manufacturing indices. This boosted cyclical sectors such as industrials and tech stocks. At the same time, financials were supported by the uptick in long-term bond yields, however minor this may have been.
Back to trade. News has it in the Chinese press that the ‘phase-one’ deal will soon be signed, on the condition that the US postpones the introduction of the customs duties planned for 15 December. These are due to affect USD 160 billion worth of imports. Donald Trump is adamant that the deal is on its home straight. That having been said, his backing of the pro-democracy demonstrators in Hong Kong has stoked tensions between the two countries, whereby the decision-making could be postponed to 2020. Besides, the mechanisms for implementing a deal are still lacking.
It is now estimated that the US economy’s GDP grew by 2.1% year on year in the third quarter instead of the previously estimated 1.9%. Separately, Fed boss Jerome Powell again stated that after three rate cuts this year, monetary policy is well calibrated for allowing the economic upcycle to continue. In Germany, the Ifo business climate survey produced a reading of 95.0, up slightly relative to October (94.7). In Switzerland, GDP was better than expected, rising by 0.4% in the third quarter and 1.1% year on year.
In China, the official PMI reading for November took the market by storm, clocking in at 50.2 (versus the expected 49.5). This was the first time above the 50 mark since April. The manufacturing PMI was 54.4, beating the forecast 53.1. A series of easing measures put into action by the People’s Bank of China (such as the lower rate charged on the one-year lending facility) have given the economy more wiggle room, and this is helping consumer spending and business investment. Expect perhaps slightly quicker growth in 2020, which should in turn support Chinese equities.
Spotlight on stocks
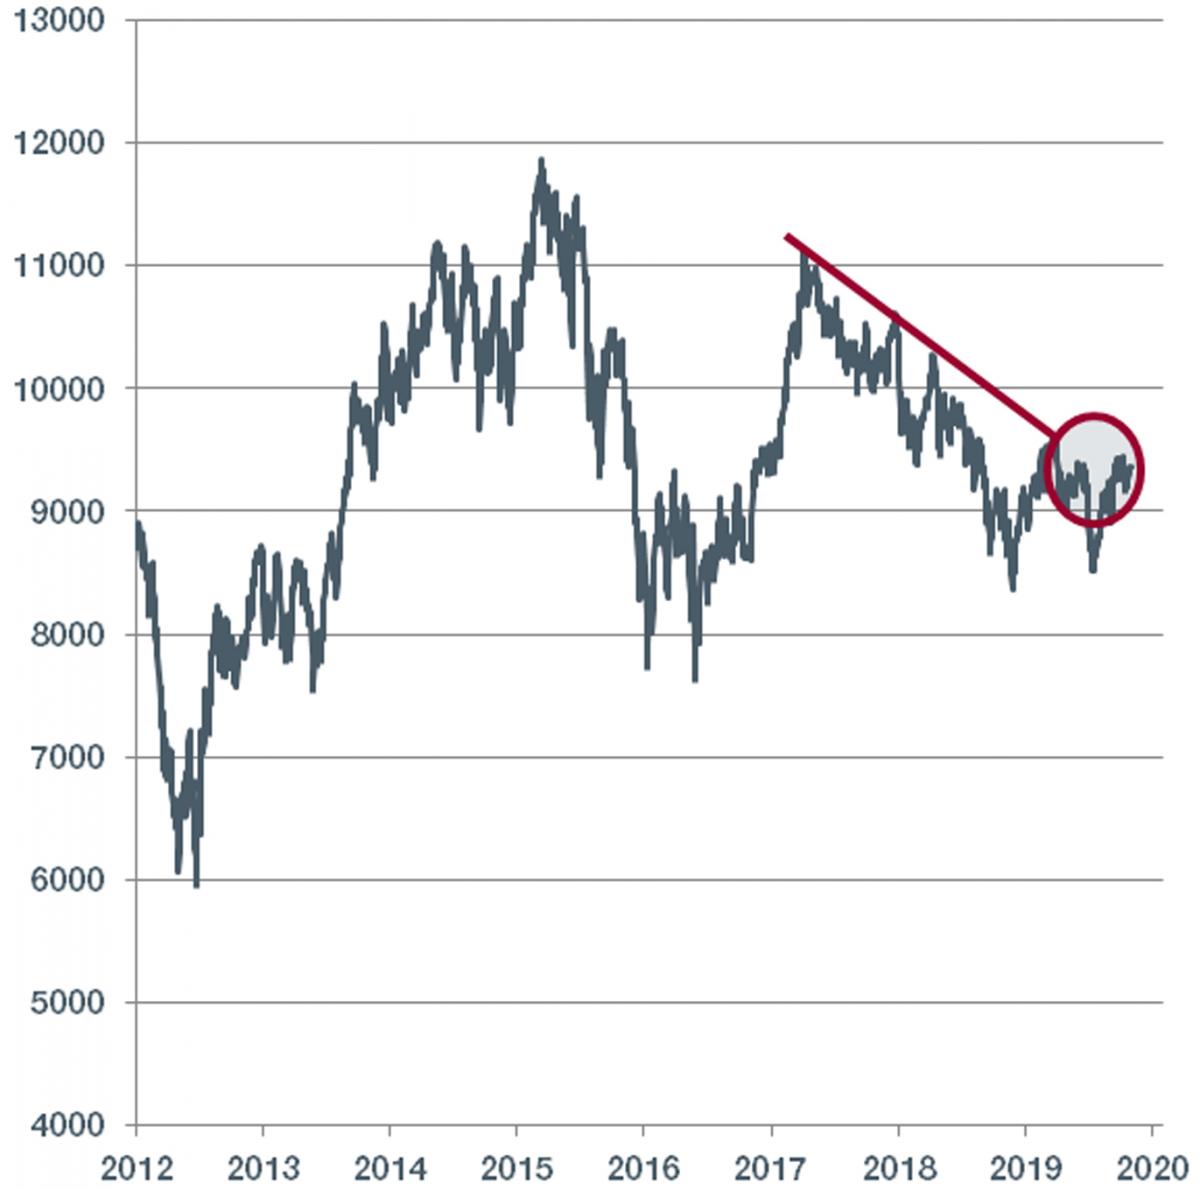
As we head towards the year-end, here are two noteworthy charts.
First of all, the ratio between US midcaps (as represented by the S&P 400 – the 400 stocks with a market capitalisation of USD 2-7 billion) and the benchmark S&P 500 of the 500 largest market-traded stocks.
The relationship between the two is currently tilting in favour of the midcaps, to an extent not seen since the financial crisis in 2008 (Chart 1). At the same time, the earnings of US midcap companies have risen more in the past decade than those of S&P 500 constituents. Current levels are an invitation to take a long position in the S&P 400.
The other chart that has attracted our attention shows the IBEX 35, which comprises Spain’s 35 leading blue chips. Unlike other European or American indices, most of which are flirting with all-time highs, the Spanish stockmarket has risen by ‘only’ 13.8% in 2019. It has underperformed the Eurostoxx 50 by close to 15% over the period. This lag is partly because 25% of the IBEX 35 is banks, which until late August were suffering under the weight of generally flat yield curves.
The Spanish blue-chip index is also attractively valued relative to the pan-eurozone index (13.5x earnings versus above 15x). Chart 2 shows a breakout to the upside on the IBEX 35, under the impetus if which it could close its gap with other indices.
Figure 1. SP400 / SP500
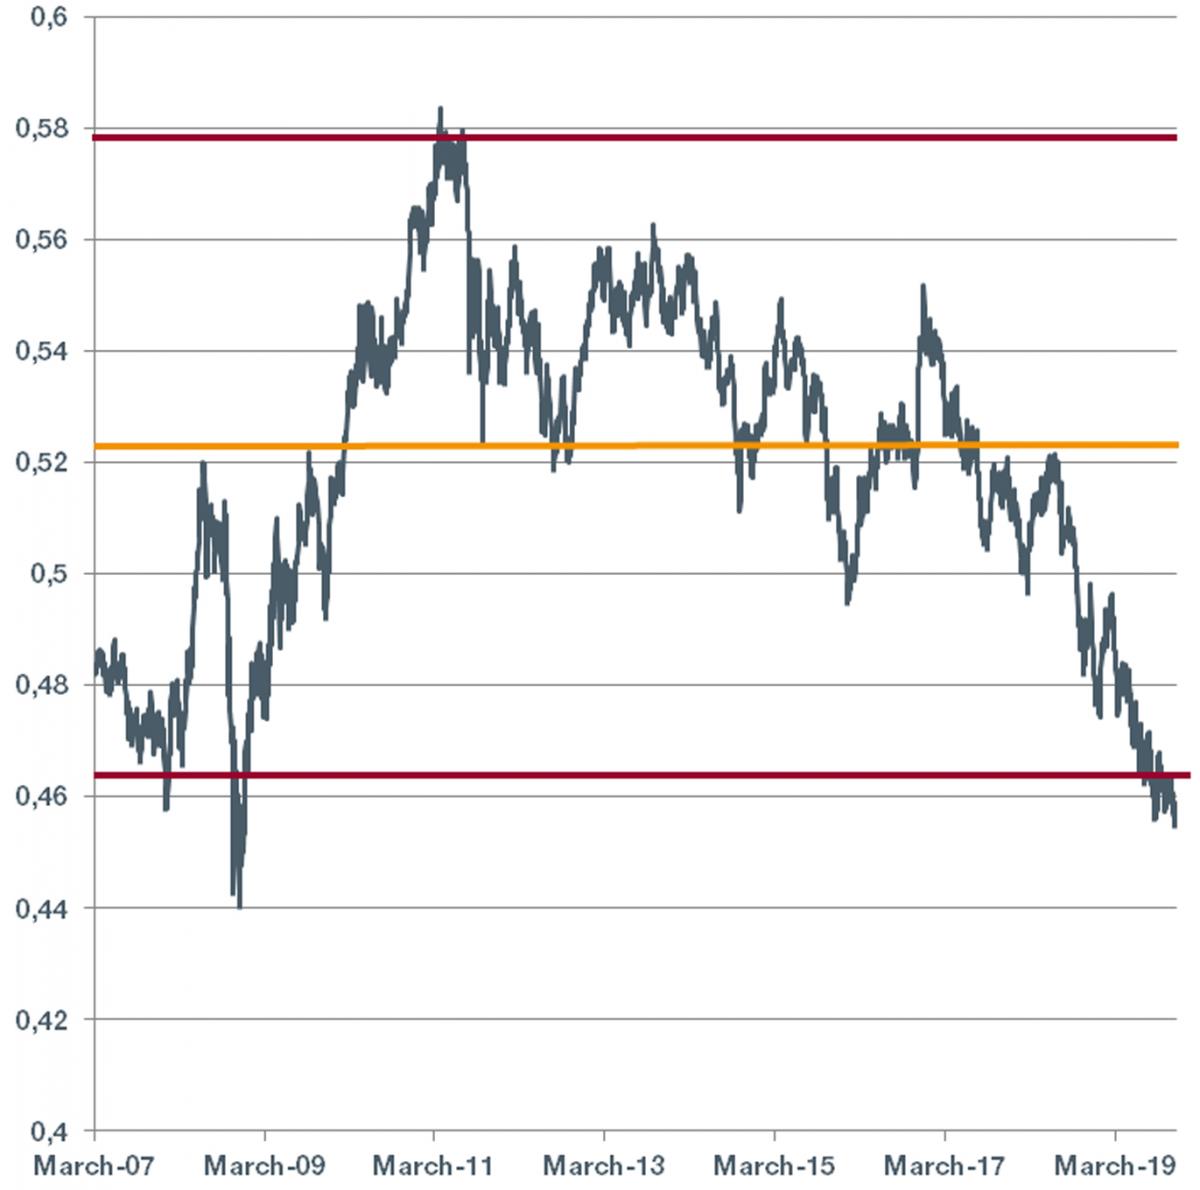
Figure 2. IBEX35