13/01/2020
Flash boursier
Key data
| USD/CHF | EUR/CHF | SMI | EURO STOXX 50 | DAX 30 | CAC 40 | FTSE 100 | S&P 500 | NASDAQ | NIKKEI | MSCI Emerging MArkets | |
|---|---|---|---|---|---|---|---|---|---|---|---|
| Latest | 0.97 | 1.08 | 10'639.49 | 3'789.52 | 13'483.31 | 6'037.11 | 7'587.85 | 3'265.35 | 9'178.86 | 23'850.57 | 1'133.63 |
| Trend | |||||||||||
| %YTD | 0.62% | -0.37% | 0.21% | 1.18% | 1.77% | 0.99% | 0.60% | 1.07% | 2.30% | 0.82% | 1.70% |
Highlights:
1. US-Iran conflict dies down
2. Chinese delegation in the US this week
Tensions at fever pitch
A string of equity indices, including the EuroStoxx 600, the S&P 500 and Nasdaq, have soldiered on to new record highs. This is quite an achievement for a week that began amid such high volatility, following the drone strike that killed Iranian general Qasem Soleimani on 3 January. Fearing this could spill over into further hostilities, investors’ first reaction was to scramble for safe havens such as the Swiss franc, yen and gold – the price of which at one point soared to USD 1611 per ounce (last seen in 2013) before retracing to USD 1550.
Additionally, potential disruption to traffic through the Strait of Hormuz, the gateway to the Persian Gulf, is seen as a risk to the world oil market and, in turn, the global economy. It is estimated that, in 2018, 21 million barrels per day passed through this narrow strait, representing 20% of the world’s daily consumption of oil and oil derivates. The flare-up in the Middle East has since returned to more manageable proportions after both the White House and Iran’s foreign ministry made it clear that they did not seek armed conflict. The news sent the price of crude lower as the China-US trade deal again became to the main consideration in the pricing of this asset.
A Chinese delegation is due to arrive in the US this Wednesday to sign the interim trade agreement, dubbed by Steven Mnuchin, Treasury Secretary, as a “historical transaction”. In his view, the hit to the US GDP from the Boeing debacle (estimated at 0.5%) will be offset by the imminent agreement, resulting in growth of approximately 2.5%. But the risk of under-shooting is high, especially because of sticking points such as the surrendering of intellectual property and commitments by China to open up its economy.
We expect the market uptrend to continue, even though lower-than-expected US jobs data for December (145,000 jobs added versus the expected 160,000) triggered a pullback. In 2019, the US economy added 2.1 million jobs compared with 2.7 million in 2018. On the wage front, pay packets grew by 2.9%, short of the 3.1% consensus forecast.
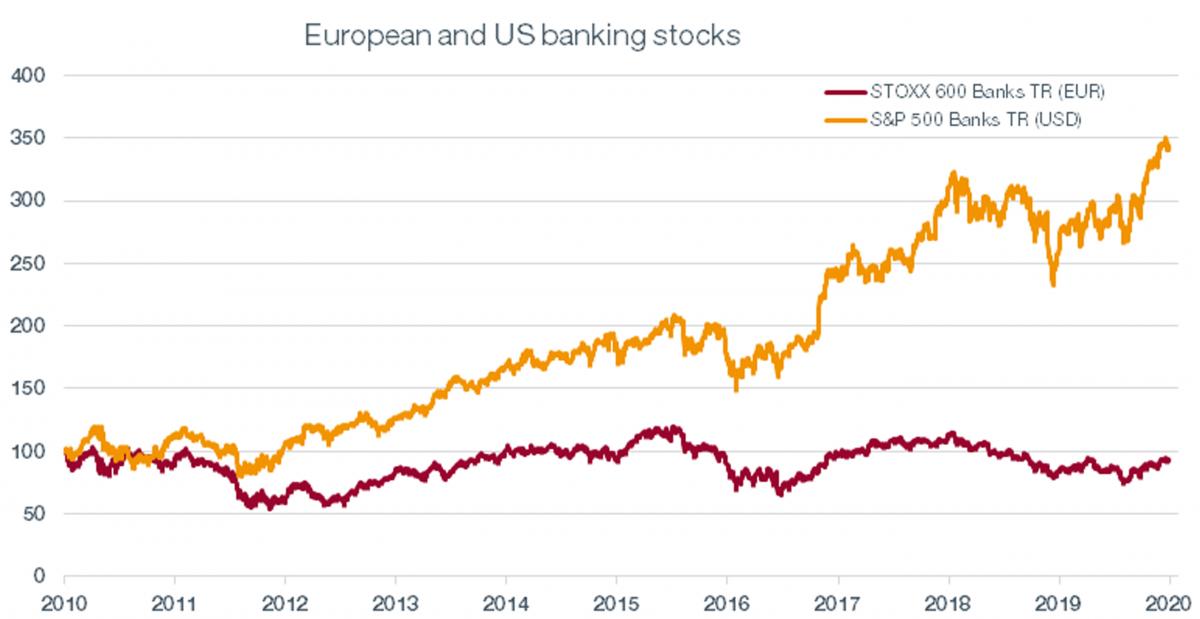
US and European banks face diverging destinies
US banking majors of the likes of JP Morgan, Citigroup and Goldman Sachs will get the ball rolling for results season later this week. In theory, the prospects between US and European banks should hardly diverge. After all, a bank is a bank, right? But look more closely and the reality is quite different.
Over the past decade, the US banking index has tripled whereas the European banks index has dropped by 8%. There are two main reasons for this.
First, the US took far more drastic measures in the wake of the 2008 financial crisis, forcing its banks to shore up their balance sheets and replenish their capital bases where needed, which enabled them to turn the page. In Europe, however, no such coordinated measures took place. Some European banks are still today slimming down their investment banks; others are still mired in poorly performing loans. This especially applies to Italy.
Secondly, interest rates are structured more advantageously in the US, where the yield curve is positive and short-term rates sit above the zero mark. In Europe, short rates are in the red and the yield curve is flat, pricing in years of economic gloom.
Hence margins are much thinner in Europe compared with the US. What will happen next? As the differences run deep, it’s hard to foresee any short-term recovery for European banks, in either absolute or relative terms.